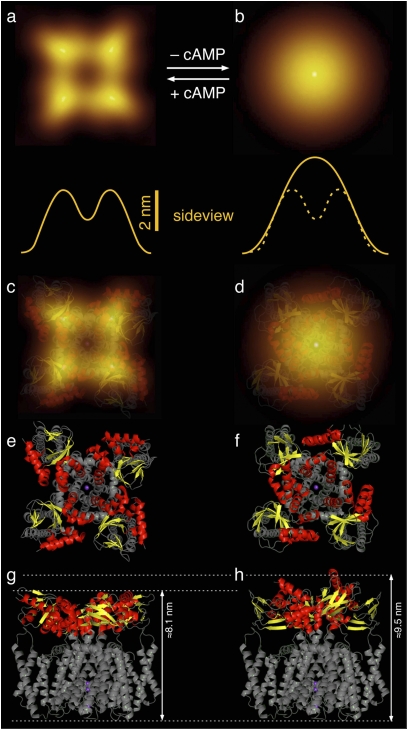
Fig. 4.
Model of the conformational change gating the cyclic nucleotide-regulated potassium channel MlotiK1. Correlation-averaged AFM topographs of the cAMP-bound (A) and -unbound (B) conformations of the cytoplasmic surface of the MlotiK1 channel. Yellow lines represent height profiles of cross-sections along the averaged topographs. The dashed yellow line is that of the MlotiK1 channel in the cAMP-bound state. (C and D) Superimposition of averaged topograph and structural models for the cAMP-bound (C) and -unbound (D) conformations. Cytoplasmic CNB domains of the MlotiK1 channel are shown in red and yellow (see E and F); transmembrane domains are shown in gray. (E–H) Top (E and F) and side (G and H) view of structural models.

