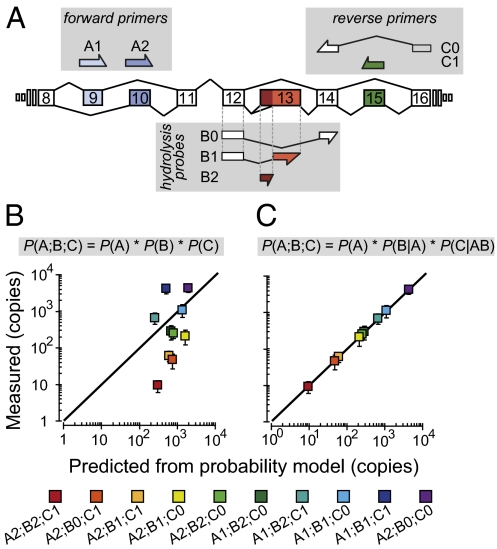
Fig. 2.
Alternative splicing across three sites is coordinated in slo-1. (A) Schematic of the recognition sequences used in the CAE-qPCR approach. Combinatorial use of these primers and probes allows the detection of all 12 slo-1 splice variants. (B and C) Copy numbers of each slo-1 splice variant were measured by CAE-qPCR in adult worms and their means plotted against the corresponding predicted values. Predictions were calculated according to the depicted formulas. Error bars are 99% confidence intervals of the means (n = 5). The solid line shows the relationship expected for a perfect match between the two datasets. Probability values for the conditional probability model were: P(A1) = 0.459, P(A2) = 0.541, P(B0|A1) = 0.000, P(B1|A1) = 0.846, P(B2|A1) = 0.154, P(B0|A2) = 0.891, P(B1|A2) = 0.055, P(B2|A2) = 0.054. P(C0|A1B0) = 0.000, P(C1|A1B0) = 0.000, P(C0|A1B1) = 0.208, P(C1|A1B1) = 0.792, P(C0|A1B2) = 0.300, P(C1|A1B2) = 0.700, P(C0|A2B0) = 0.989, P(C1|A2B0) = 0.011, P(C0|A2B1) = 0.776, P(C1|A2B1) = 0.224, P(C0|A2B2) = 0.964, and P(C1|A2B2) = 0.036.

