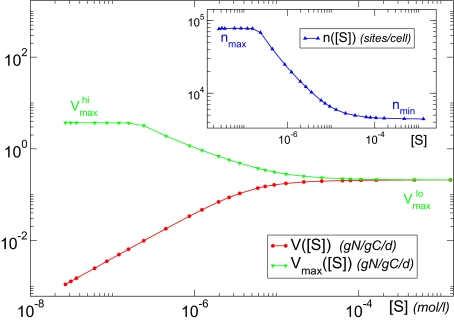
Fig. 2.
Stationary values of the uptake rate V (red) and maximum uptake rate Vmax (green) for different external nutrient concentrations [S]. In contrast to the classic MM formulation, in our approach, Vmax is not constant but varies with [S], increasing as [S] decreases. (Inset) Same plot for the number of uptake sites.

