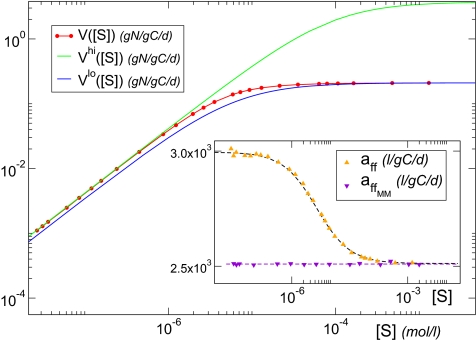
Fig. 3.
Maximum (green) and minimum (blue) potential uptake-rate curve for an organism represented by our approach; the effective uptake rate of the cell (red) is a composition of the different potential curves for each nutrient concentration. (Inset) Stationary values for the affinity obtained with our approach (orange) and the diffusion limited-corrected MM approach (violet).

