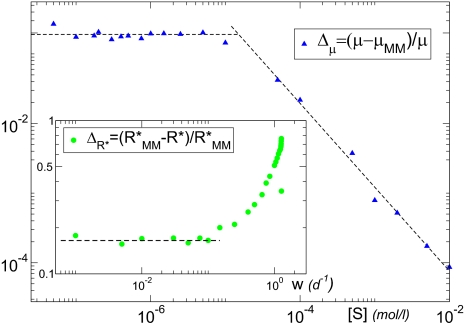
Fig. 4.
Relative error between our dynamic approach and the static, diffusion limitation-corrected MM approach. The error related to the growth rate, Δμ, increases as [S] decreases, reaching in this specific example 19 ± 2%. (Inset) The error related to the break-even concentration,  , increases with the dilution rate w, that is, the frequency of the changes in environmental conditions. The behaviors of both Δμ and
  indicate an enhanced survival probability for organisms that can regulate the kinetic parameters.

