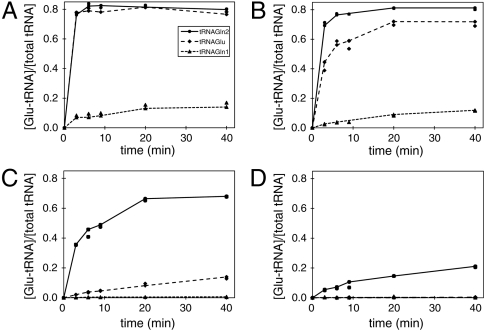
Fig. 2.
Plateau tRNA charging curve. The plot shows the fraction of Glu-tRNA formation over the total amount of tRNA during the time course of the reaction. Plateau charging levels were measured for the enzymes WT-GluRS (A), AL3-GluRS (B), ASL1-GluRS (C), and ASL2-GluRS (D) with the tRNA substrates (see Fig. 1): tRNAGln2 (●), tRNAGlu (⧫), and tRNAGln1 (▴). In the reactions, 1 μM enzyme and 10.4 μM tRNA were used.

