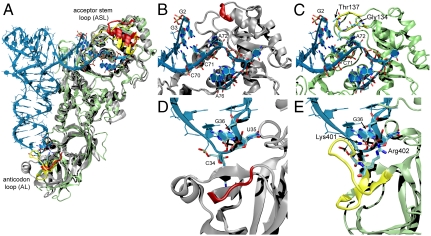
Fig. 3.
A structural comparison (A) of the M. thermautotrophicus GluRS (silver) (11) and the E. coli GlnRS (green) tRNAGln (blue) complex (12). Enlarged views of the ASL region are shown for (B) GluRS and (C) GlnRS. Larger view of the AL region are also shown for (D) GluRS and (E) GlnRS. Regions of GlnRS (yellow) swapped for regions in GluRS (red) in the ASL and AL-GluRS variants are highlighted. Sequences for each mutant are in Fig. 4. In panels showing the GluRS (B, D), the E. coli tRNAGln is included for reference.

