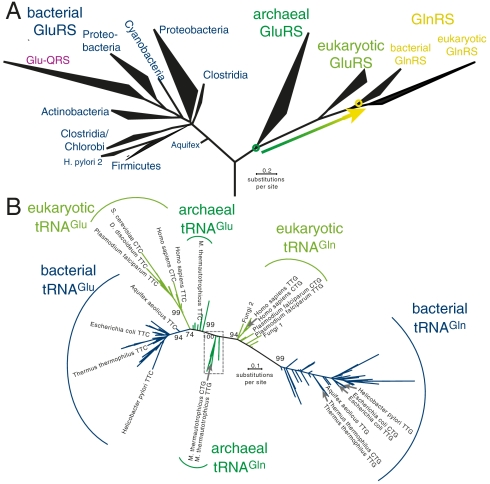
Fig. 5.
Phylogenetic trees showing the evolution of (A) GluRS and GlnRS, and (B) tRNAGlu and tRNAGln. The schematic GluRS and GlnRS phylogeny (A) shows only the major phylogenetic groups from a previously calculated tree (11). The arrow indicates evolution of GlnRS from an archaeal-like nondiscriminating GluRS ancestor. A maximum likelihood phylogeny is shown (B) that was calculated from an alignment of 753 tRNAGlu and tRNAGln sequences. Major clades and a few representative taxa are labeled. Bootstrap values are given for the major clades only (for a tree showing all taxa and bootstrap values see Dataset S1). Branches completely lacking support are collapsed. The boxed region is shown in complete detail in Fig. S4.

