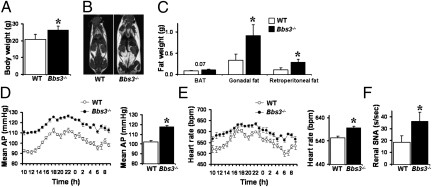
Fig. 2.
Bbs3−/− mice have increased body weight and arterial pressure. (A–C) Comparison of (A) body weight and fat mass as assessed by MRI (B) and weight of individual fat depots (C) between Bbs3−/− mice and WT littermate controls. Although Bbs3−/− mice have increased white adipose tissues like gonadal fat and retroperitoneal fat, they do not have increased brown adipose tissue (BAT). (D–F) Comparison of (D) mean arterial pressure (AP), (E) heart rate, and (F) renal SNA between Bbs3−/− mice and WT littermate controls. *P < 0.05 vs. WT controls.

