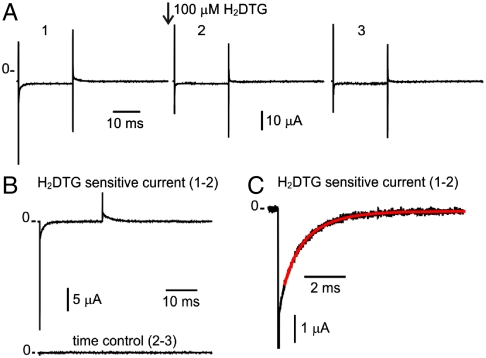
Fig. 3.
Na+ translocation by the Na+/K+-ATPase. (A) Current traces in response to a voltage step to -80 mV from a holding potential of 0 mV. Trace 1 was acquired immediately before the application of 100 μM H2DTG to the external solution. Trace 2 was acquired after complete pump inhibition (approximately 25 s after H2DTG application). Trace 3 was acquired approximately 25 s after trace 2. (B) Pump-mediated Na+ translocation (Upper) is obtained by subtracting the nonspecific membrane current of trace 2 from trace 1. The stability of the preparation was assessed by subtracting similar time-spaced acquisitions (Lower). (C) Expanded form of the On transient current in response to the voltage step to -80 mV. The solid line represents a two-component exponential fit to the current relaxation with best fit parameter values for the time constants of 0.56 and 1.44 ms.

