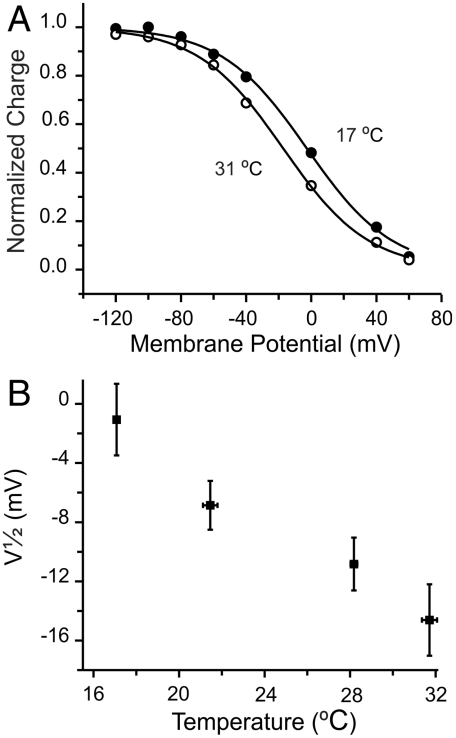
Fig. 6.
Influence of temperature on the voltage dependence of charge distribution. (A) Charge distributions. Normalized charge moved by the slow component from an axon exposed at 17 (●) and 31 °C (∘). Solid lines represent Boltzmann fits with midpoint values of -3 ± 1 (17 °C) and -17 ± 1 mV (31 °C). (B) Shift of voltage dependence with temperature. Data were grouped similarly as in Fig. 5.

