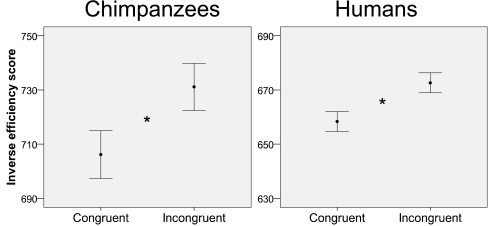
Fig. 3.
Error bar graphs of the adjusted (61) IE scores (i.e., median RT for correct trials divided by proportion of correct responses) (22–24) for chimpanzees (Left) and humans (Right) for congruent (white and high pitch, black and low pitch) and incongruent trials (white and low pitch, black and high pitch). A smaller IE indicates better performance. Error bars represent the 95% confidence interval of the mean. *P < 0.05 (two-tailed).

