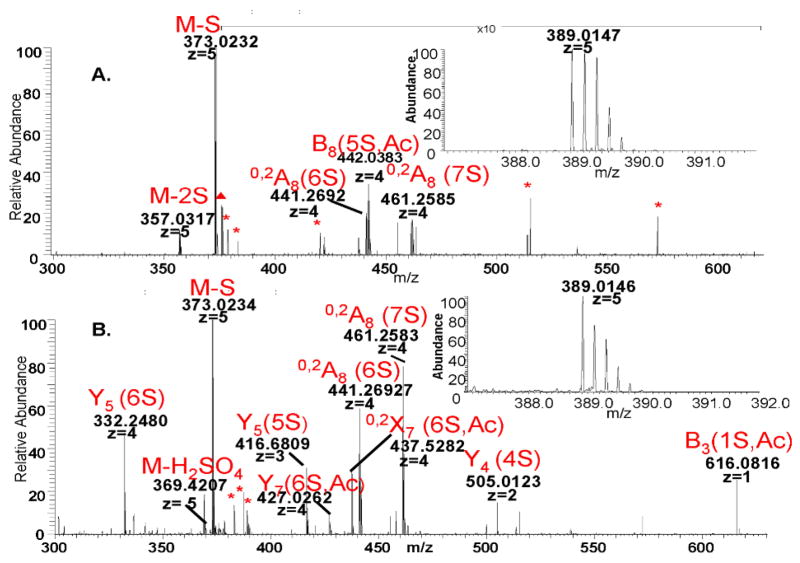
Figure 4. CID MS2 spectrum of [1,3,4,7,1] composition in the library versus the bound fraction.
The insets show the isolation of the precursor ion. The peaks are labeled with their corresponding structure, (
 ) if they could not be assigned to a structure and (*) if they are background noise.
A. Tandem mass spectrum of [1,3,4,7,1] in the library. One interval of the spectrum has been magnified as indicated in the figure for better visibility of the fragments.
B. Tandem mass spectrum of [1,3,4,7,1] in the bound fraction. The isotopic pattern of the precursor (inset) is skewed compared to that of the precursor in the library due to an artifact introduced upon application of the isolation window.

