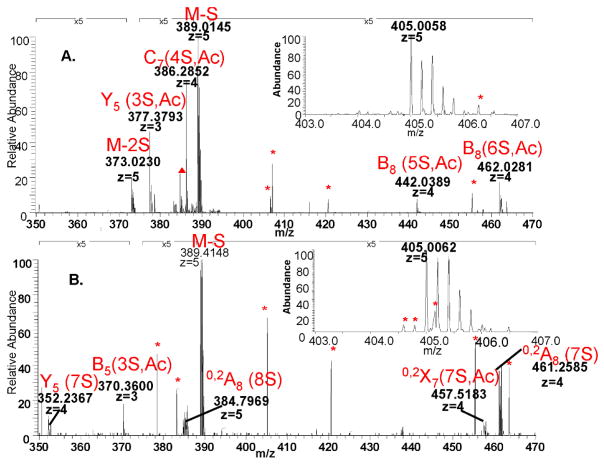
Figure 5. CID MS2 spectrum of HS [1,3,4,8,1] composition. The legend is similar to that in Figure 4.
A. library
B. ATIII-bound fraction. The ions co-isolated with the precursor (inset) do not fall into a pattern that may be assigned to a charge state and do not correspond to expected values for heparin/HS oligosaccharides. Hence they are labeled as co-isolated noise.

