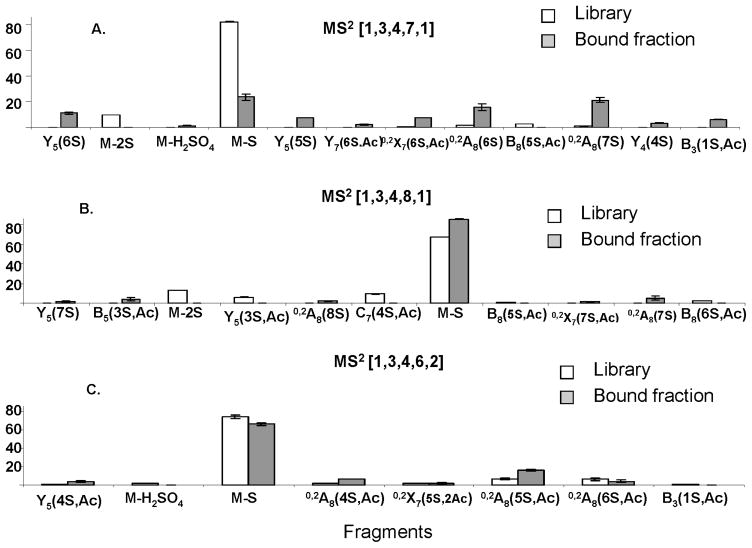
Figure 7. Enrichment of specific isomers in the bound fractions.
Comparison of CID MS2 profiles of three HS compositions between the library and the bound fractions. The y axis represents the percent abundance of an ion relative to the total abundance of all ions combined.
A. [1,3,4,7,1]
B. [1,3,4,8,1]
C. [1,3,4,6,2]

