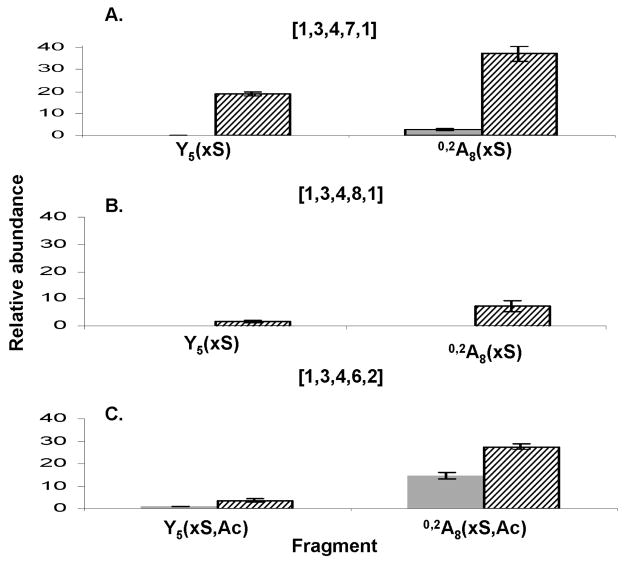
Figure 8. Enrichment of diagnostic ions in the bound fraction.
The relative abundances of all the ions of the general formula Y5(xS) on the one hand and 0,2A8(xS) on the other have been summed together to produce the respective summed relative abundances. X indicates the number of sulfates. The figure shows the enrichment of these ions for the singly acetylated compositions [1,3,4,7,1] (A) and [1,3,4,8,1] (B). A new standard deviation has been calculated from the individual standard deviations of the relative abundances of each individual ion.
In (C), the same procedure was applied to Y5(xS,Ac) and 0,2A8(xS,Ac) in the doubly acetylated composition [1,3,4,6,2].

