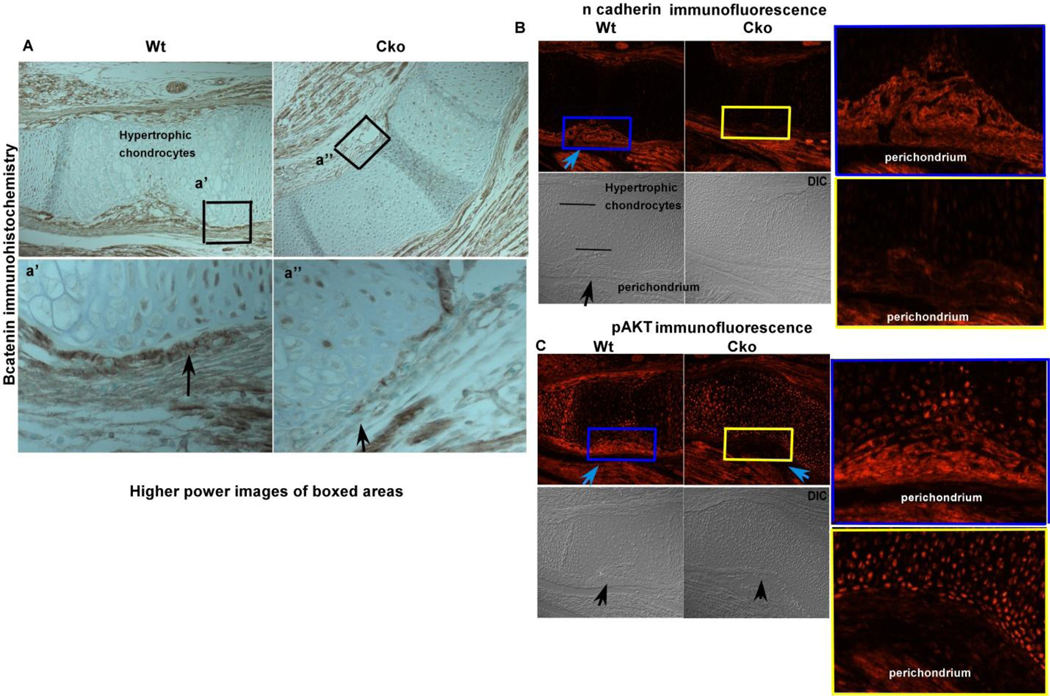
FIG. 5). Effect of loss of β-catenin on adherens junctions.
Fig. 5A) Loss of β-catenin protein shown using immunohistochemistry and counterstained with methyl green, the higher power images of the boxed (black) regions are shown in the bottom panel below. The black arrows point out the regions where there is less protein signal in the cko (right panel) compared to the wt control. Fig. 5B) Decreased N-cadherin expression in the β-catenin cko compared to the wild type control. The blue arrow shows the region of the perichondrium which shows N-cadherin signal, the bottom panels (DIC, differential interference contrast) show the same regions pointed out with black arrow, the blue and yellow colored boxed regions are magnified and shown on the right hand side for both the cko and wt samples. Fig. 5C) Decreased pAKT levels in the β-catenin cko (blue arrow) compared to the wildtype control, the bottom panels are the DIC images. The area between the blue and yellow boxes are enlarged and shown besides the fluorescence images for better visualization. (DIC, differential interference contrast)

