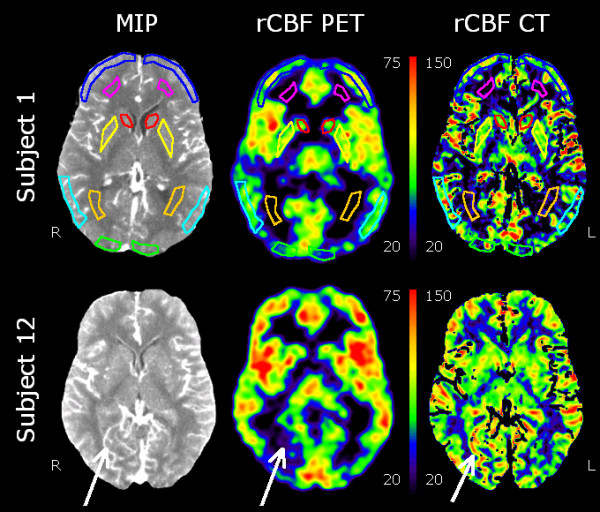
Figure 1.

Co-registered transaxial slices through the level of the basal ganglia. Co-registered transaxial slices showing MIP from perfusion CT integrated over 40 s (left), the rCBF images using PET (centre), and perfusion CT (right) quantified in millilitre per minute per 100 g. For a better comparison, the rCBF PET and rCBF CT images are displayed in different scales. The top row shows the location and configuration of ROIs in the frontal cortex (dark blue), parietal cortex (light blue), occipital cortex (green), caudate nucleus (red), putamen (yellow), frontal white matter (purple), and occipital white matter (orange). High-intensity areas in the MIP images represent larger vascular volumes around the vessels of the cortex and insula, the choroid plexus, and the sinuses. These are partly, but not completely, removed by masking the rCBF CT images. This discrepancy between the two techniques is evident around a right-sided occipital vein that is visualised in rCBF CT, but not in rCBF PET (white arrow, bottom row).
