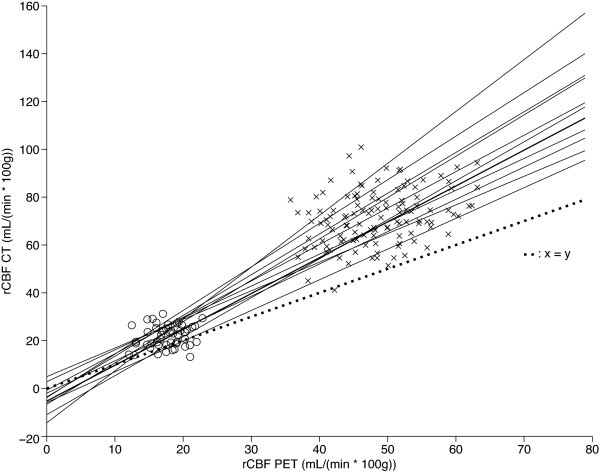
Figure 3.
Scatter plot of rCBF CT against rCBF PET. Linear regression lines are shown for each subject (n = 12). The line of perfect agreement is indicated. The rCBF CT values are clearly biased towards higher rCBF values, and the regression slopes are all above 1.0. Cross mark, grey matter; empty circle, white matter.

