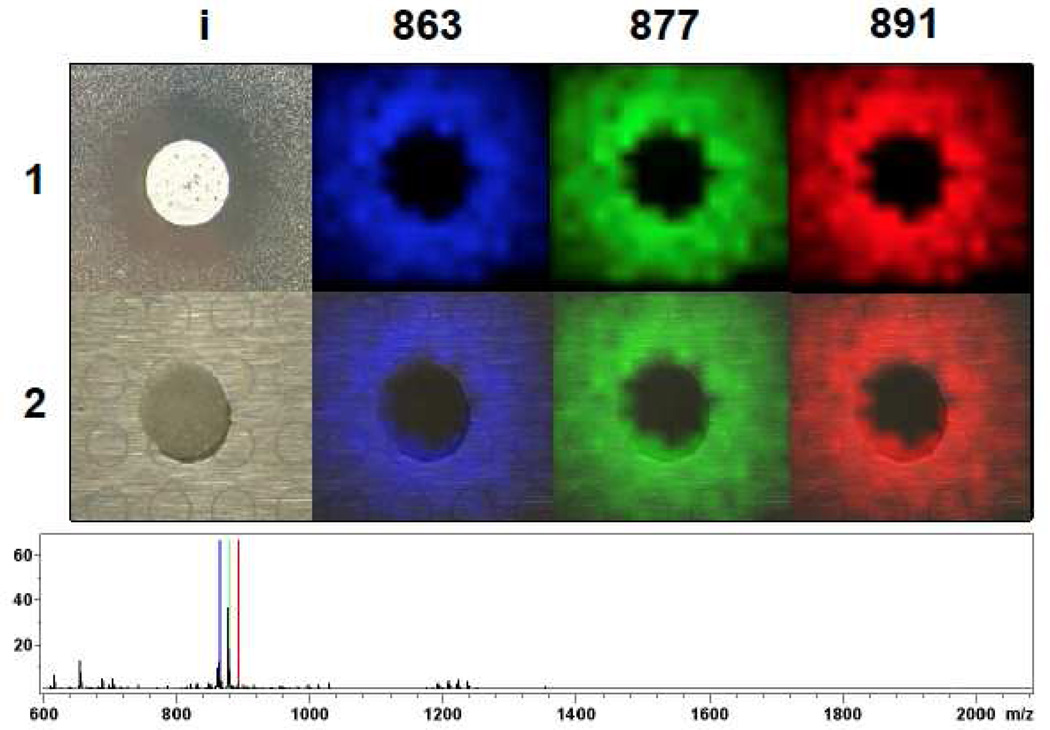
Figure 2. IMS of S. roseosporus spotted on top of a S. epidermidis lawn.
(1) ion distribution of compound 1–3 (863, 877, 891) observed in IMS. 1i is a photograph showing S. roseosporus inhibit Staphylococci growth. (2) Superimposition of the photograph with IMS data on top of MALDI target plate. Average mass spectrum of each IMS experiment was shown below IMS images with signals correlated to compound 1–3 labeled with corresponding color as displayed in images.

