Figure 4.
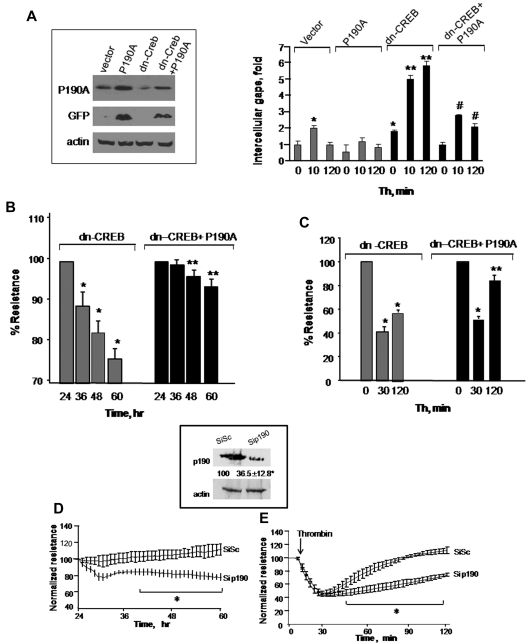
Restoration of p190RhoGAP expression rescues endothelial barrier defect in CREB-impaired endothelial cells. (A) HPAE cells were cotransduced with control cDNA plus GFP-tagged p190-A cDNA or dn-CREB mutant along with green fluorescent protein (GFP)-tagged p190-A cDNA. After 24 hours, cells were lysed, and lysates were immunoblotted with anti-GFP and anti-p190-A antibodies to determine protein expression (inset). In parallel, cells were stimulated with thrombin for indicated times, fixed, and stained with anti–VE-cadherin antibody and viewed under confocal microscope. Intracellular gap areas were quantified using National Institutes of Health ImageJ Version 1.44 software. The values shown are representative of 3 independent experiments. Asterisk (*) indicates values different from unstimulated control vector-expressing cells (P < .05), and double asterisk (**) indicates values different from corresponding thrombin-stimulated control vector-transducing monolayers (P < .05). Pound (#) indicates values different from corresponding thrombin-stimulated dn-CREB–transducing monolayers (P < .05). (B-C) HPAE cells cotransducing indicated cDNA were stimulated without (B) or after thrombin stimulation (C), and TEER was determined at indicated times. Data represent mean ± SD of percentage of decrease in TEER. Asterisk (*) indicates values different from value at 24 hours (P < .05), and double asterisk (**) indicates values different from dn-CREB vector-transducing monolayers with and without treatment of thrombin (P < .05). (D-E) Effect of p190-A knockdown on endothelial monolayer permeability. HPAE cells were transfected with 2.4 μg of SiSc or p190-A siRNA for 48 hours, after which changes in TEER were determined without (D) or after thrombin stimulation (E). Inset, cell lysates were immunoblotted 48 hours after transfection using anti–p190-A antibody to analyze p190-A expression. Immunoblot with anti–β-actin antibody was used as a loading control. Plot shows mean ± SD from 3 experiments performed in duplicates. Asterisk (*) indicates values different from corresponding SiSc-transfected endothelial monolayers (P < .05).

