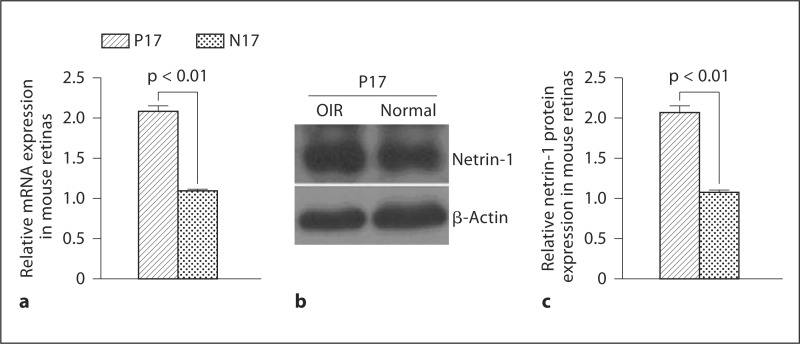
Fig. 1.
Western blot analysis of netrin-1 expression in murine retinas: netrin-1 mRNA (a), representative Western blot (b), and netrin-1 protein (c). Results are expressed as means ± SEM and analyzed by one-way ANOVA followed by the LSD t test to evaluate significance (n = 6/group). Both mRNA and protein expression of netrin-1 were significantly elevated in the retinas of P17 OIR mice compared with age-matched N17 controls (p < 0.01).

