
Figure 1.
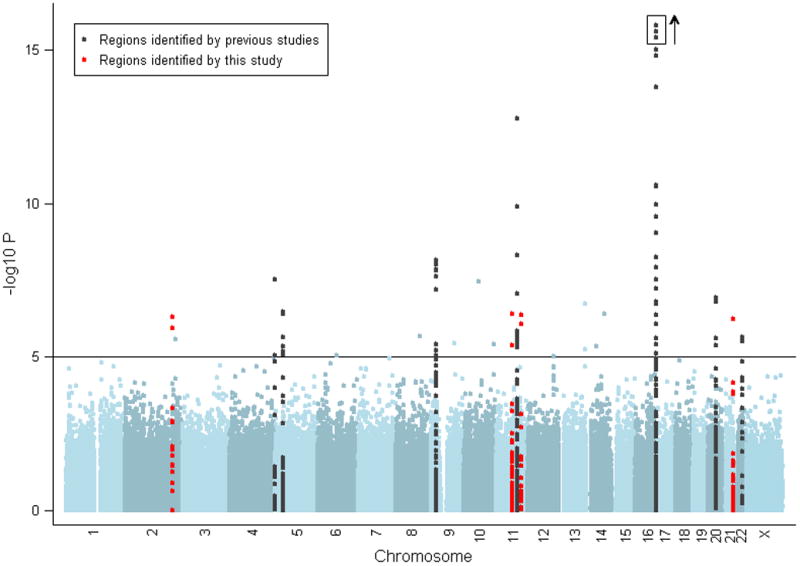
Manhattan plot of results of Cochran-Armitage (CA) trend test stratified by geographic region, with -log10 p-values shown. The solid horizontal line indicates a p-value of 10−5. Markers within 50kb of a SNP associated with melanoma are marked in black for those identified in a previous GWA and replicated here and marked in red if first identified in the current study. The y-axis is truncated at p=10−15, although three SNPs in the MC1R region have stronger p-values, up to 2.7×10⁻²⁷, as signified by the box and arrow.