Figure 3.
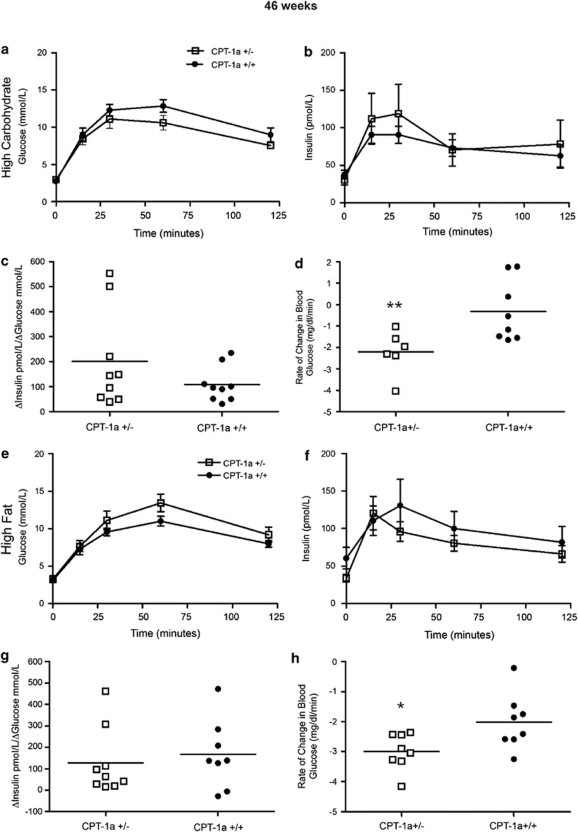
Effects of diet on glucose and insulin tolerance in CPT-1a+/− mice after 46 weeks. (a–c) Glucose levels, insulin levels and insulinogenic indexes throughout glucose tolerance test in CPT-1a+/− (n=11) versus CPT-1a+/+ (n=10) mice fed HCD. (d) Insulin tolerance test. Slopes for the rate of decline of glucose (**P=0.0088) in response to an intraperitoneal injection of insulin for CPT-1a+/− (n=6) and CPT-1a+/+ (n=9) mice fed HCD. (e–g) Glucose levels, insulin levels and insulinogenic indexes throughout glucose tolerance test in male CPT-1a+/− (n=9) versus CPT-1a+/+ (n=9) mice fed HFD. (h) Insulin tolerance test. Slopes for the rate of decline of glucose (*P=0.0129) in response to an intraperitoneal injection of insulin for CPT-1a+/− (n=8) and CPT-1a+/+ (n=8) mice fed HFD.

