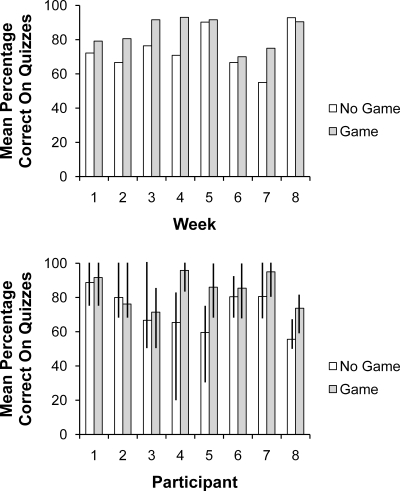
Figure 1.
Mean percentage correct on quizzes for students who played the review game and participated in the attention control. Weekly group performance is displayed in the top panel. Individual performance in each condition is displayed in the bottom panel. Error bars represent the range of quiz scores.

