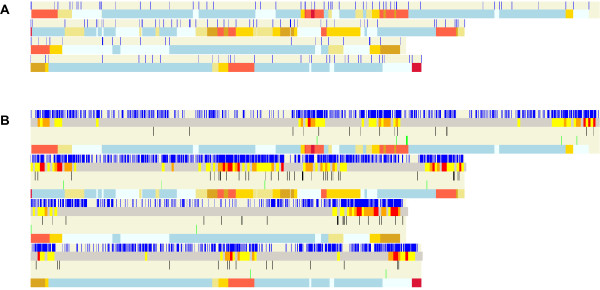
Figure 2.
Screenshots of Fgra3Map linking Fusarium graminearum gene information to the genetic map. (a) The position of each molecular marker is shown in blue on each of the four chromosomes. The corresponding frequency of recombination is shown below the marker display for each chromosome using a colour gradient described in the first #-line of the .freq data file i.e. # clBeige 1 clKhaki 2 clGold 3 clGoldenRod 4 clTomato 8 clCrimson. The numbers between the colours are boundary values in cM/27 kb-so beige represents the lowest and crimson the highest recombination frequency. This information was retrieved from [23]. (b) The distribution of SNPs in the Fusarium graminearum genome compared with genetic recombination frequency and genes coding for putative cell wall degrading enzymes. There are 5 rows shown for each chromosome and each chromosome is separated from the next by a thin, horizontal white line. For each chromosome the top row shows the SNPs as thin, vertical blue lines. This information was retrieved from [23]. The second row shows the SNP density, the third row shows the genes coding for putative cell wall degrading enzymes coloured black, the fourth row shows the genes coding for polyketide synthases and the fifth row shows the genetic recombination frequency (as in Figure 2a).

