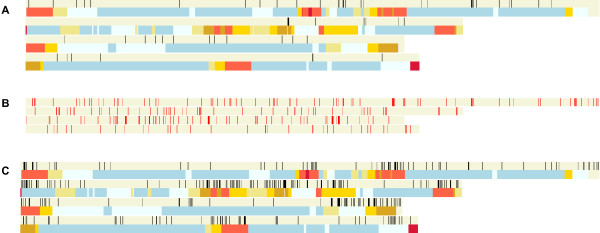
Figure 3.
Screenshots of Fgra3Map linking verified Fusarium graminearum gene function information, to gene function predictions and to gene expression information. (a) The distribution of experimentally verified Fusarium graminearum pathogenicity and virulence genes. Each gene is displayed in black on the chromosomes. As of April 2011, 61 genes have been published (PHI-base 3.2 and Additional file 2). The second row shows the genetic recombination frequencies. (b) The distribution of homologues of pathogenicity and virulence genes revealed through experimentation in a range of plant and animal pathogenic species (PHI-base version 2.1 [44]). The F. graminearum homologues were found by BLASTP search using an E-value cut-off of e-100. The location of each gene homologue is shown in red on the chromosomes. (c) Fusarium graminearum genes expressed specifically in planta (barley) displayed using the Transcriptomics/Barley in planta menu. The genes are displayed in red on the chromosomes. Data sources: see [45] and Plexdb [46] for Fusarium experiments FG1 and FG2.

