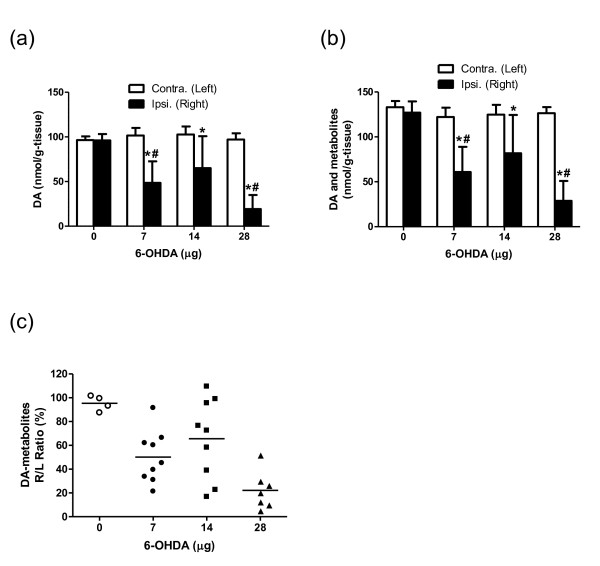
Figure 4.
Dose profiles of 6-OHDA on the striatal DA and its metabolite contents. The influence of 6-OHDA on the striatal level of (a) DA, (b) DA and its metabolites, and (c) DA and its metabolites in each animal expressed as the percentage ratio of the ipsilateral (right) to the contralateral (left) side. 6-OHDA: 0 μg, n = 4; 7 and 14 μg, n = 9; 28 μg, n = 7. Asterisk (*): significant difference vs. the contralateral side, paired Student's t test; number sign (#): significant difference vs. 0 μg group, one-way ANOVA followed by Dunnett's multiple comparison test.

