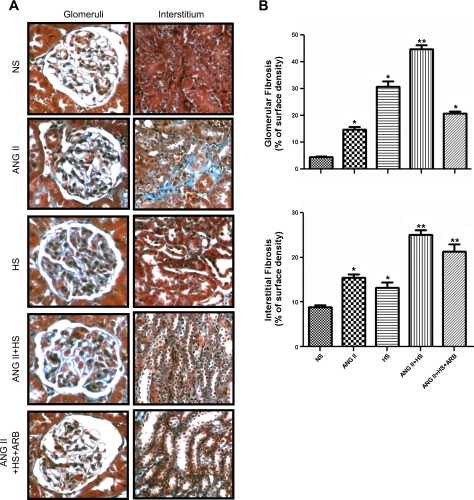
Fig. 3.
Representative photomicrographs of collagen deposition visualized by Masson's trichrome stain in glomeruli (×400) and tubulointerstitial areas (×200; A). Twenty different microscopic fields per tissue section per animal (n = 3/group) were analyzed from paraffin kidney sections (3 μm). The extent of the interstitial fibrotic-positive area was evaluated quantitatively by automatic image analysis (B and C), which determined the area occupied by interstitial tissue staining positive in Masson's trichrome-stained sections (blue). Values are means ± SE expressed as a percentage of the blue areas/field. *P < 0.01 vs. NS. **P < 0.01 vs. ANG II.

