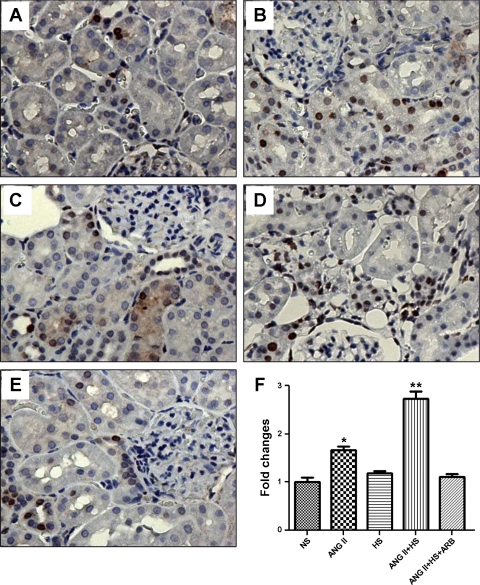
Fig. 5.
Cell proliferation in renal tissue sections (3 μm) from rats (n = 3) subjected to NS intake (A), chronic ANG II infusion (B), HS intake (C), ANG II chronic infusion and HS diet (ANG II+HS; D), and chronic ANG II infusion plus HS and treatment with ARB (ANG II+HS+ARB; ×200; E). Tissue sections were stained with monoclonal antibody for proliferating cell nuclear antigen (PCNA; 1:1,000 dilution). The number of positive proliferative nuclei (stained brown)/mm2 appears in F expressed as fold-changes relative to NS. Values are means ± SE. *P < 0.05 vs. NS. **P < 0.05 vs. ANG II.

