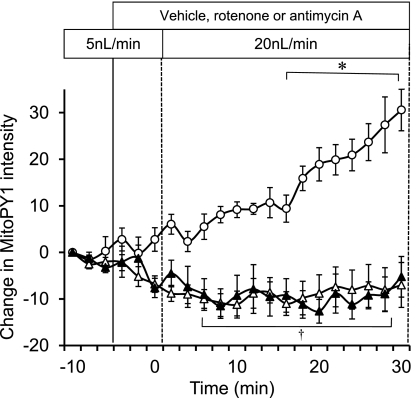
Fig. 4.
The effect of disruption of the mitochondrial respiratory chain on mTAL mitochondrial H2O2 production in response to change in flow rate was determined using 10 μM rotenone (n = 5; ▵) or 1 μM antimycin A (n = 6; ▴). Responses were compared with the vehicle control group (○; n = 6). Mitochondrial H2O2 is expressed as the mean ± SE of the change in intensity of the fluorescent dye MitoPY1. Significant differences *across time and †compared with the vehicle group (P < 0.05).

