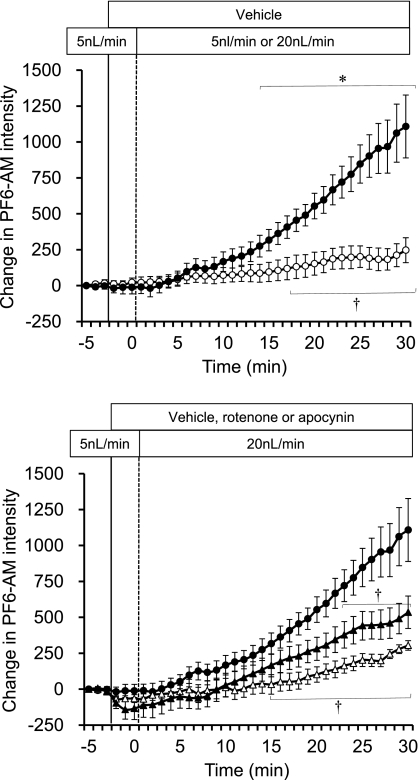
Fig. 7.
Using the intracellular H2O2 fluorescent dye, PF6-AM, the effect of flow rate was determined. mTALs were perfused with vehicle, 1 mM apocynin, or 10 μM rotenone during the change in flow rate from 5 to 20 nl/min, and the intracellular H2O2 was determined and compared with the control group with flow maintained at 5 nl/min. Intracellular H2O2 is expressed as the mean ± SE of the delta change in intensity of the fluorescent dye PF6-AM. Top: comparison of the vehicle (n = 6; ●) with change in flow to the time control group with flow maintained at 5 nl/min (n = 5; ○). Significant differences *across time and †compared with the vehicle group (P < 0.05). Bottom: rotenone (n = 5; ▴) and apocynin (n = 5; ▵) treatment compared with the vehicle group (●). †Significant differences compared with the vehicle group (P < 0.05).

