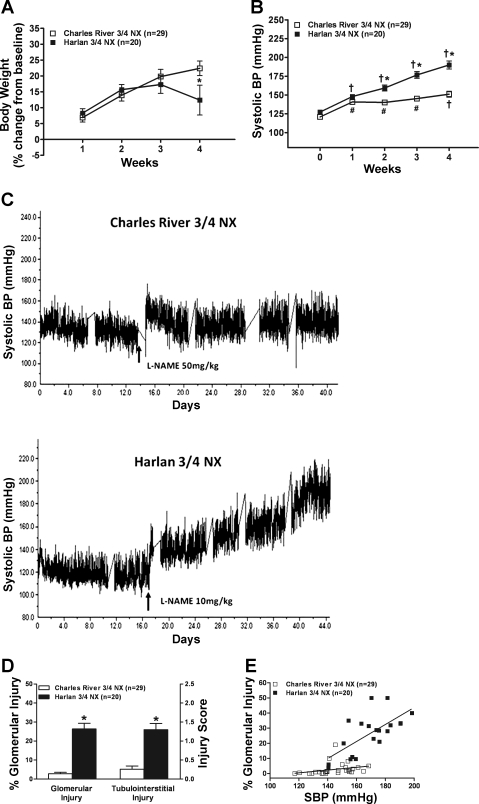
Fig. 4.
A: weekly changes in body weight (%change from baseline) during 4 wk of l-NAME in CR-nephrectomy (NX) (400–500 mg/l of drinking water) and H-NX rats (50–100 mg/l of drinking water) that had undergone normotensive (3/4) NX by surgical excision 2 wk earlier. *P < 0.05 vs. CR. B: systolic BP course (weekly averages) before (0 wk) and during the 4 wk of l-NAME. *P < 0.02, maximum vs. CR. #P < 0.01, maximum vs. pre-l-NAME BP. †P < 0.05, maximum vs. all other time points in the same strain (CR or H). C: illustration of the course of systolic BP in representative CR-NX and H-NX rats. D: glomerular injury (%) and semiquantitative Tubulointerstitial Injury Score after 4 wk of l-NAME at the termination of the studies in CR and H rats who had undergone NX 2 wk earlier. *P < 0.0001 vs. CR. E: linear regression analysis of the slope of the relationship between the average systolic BP during the 4 wk of l-NAME administration and the percent of glomeruli that exhibited injury lesions at the termination of the studies in CR and H rats. CR rats: slope 0.09 ± 0.06, r = 0.29; P = 0.12; H rats: slope 0.56 ± 0.14, r = 0.69, P < 0.008. The slopes were significantly different between CR and H rats, P < 0.01.

