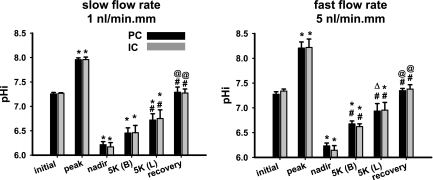
Fig. 3.
Steady-state pHi values of PC and IC in CCDs microperfused at slow (n = 4; left) and fast (n = 5; right) luminal flow rates before and during recovery from an in vitro acid load. The pHi values indicated include initial in Na+-Ringer solution; peak after addition of 20 mM NH4Cl to the bathing solution; nadir after washout of the NH4Cl pulse; steady state on cessation of Na+- and luminal K+-independent pHi recovery [5K (B)]; steady state on cessation of luminal K+-dependent, Na+-independent pHi recovery [5K (L)]; and the recovery value attained on restoration of Na+ to the bath solution. Values are means ± SE. *P < 0.05 vs. initial value. ΔP = 0.05 vs. initial value. #P < 0.05 vs. nadir value. @P < 0.05 vs. 5K (B) value.

