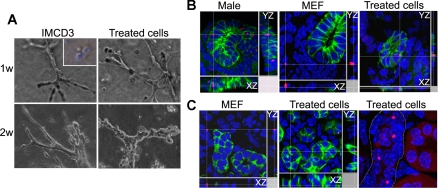
Fig. 3.
Treated cells have the potential for tubulogenesis. A: formation of tubular structures after 1 or 2 wk in 3-dimensional cultures. Renal epithelial cell line IMCD3 cells were used as positive controls. Inset: untreated bone marrow cells fail to grow and form tubules. B: integration of treated cells into renal tubules in embryonic kidney organ cultures. Treated cells generated from male Lin− cells were cocultured with fragmented embryonic day 13.5 (E13.5) female kidneys for 1 wk. XZ and YZ images indicate that male cells [red, fluorescent in situ hybridization (FISH) signals] were integrated into female renal tubules and expressed epithelial marker E-cadherin (green, right). Control male mouse embryonic fibroblast (MEF) cells (red, FISH signals) were only detected outside the tubular structure (middle). Cultures of male embryonic kidney fragments were used as positive controls for Y-chromosome FISH analysis (left). C: integration of male treated cells (red, FISH signals) into female postischemic kidneys after injection under the renal capsule (middle). Control male MEF cells (left) failed to integrate into renal tubules. E-cadherin (green) labels epithelial cells. XZ and YZ images are shown. Right: renal tubule (dotted outline) with relatively more integration of male treated cells (red, FISH signals).

