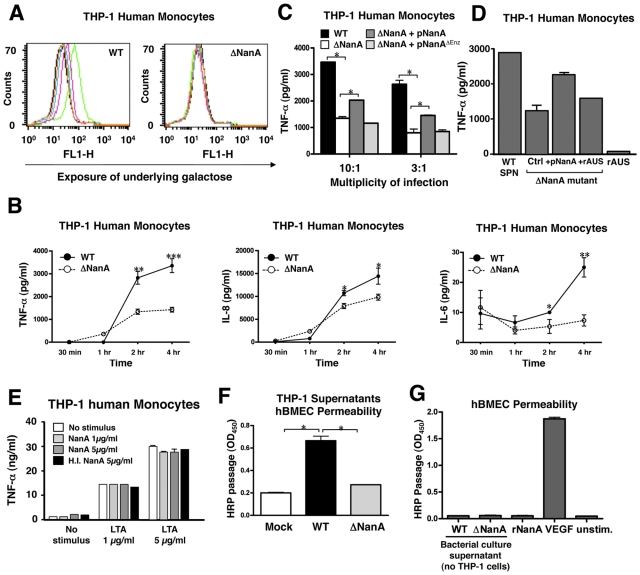
FIG 1 .
S. pneumoniae sialidase (NanA) mediates cell surface desialylation and increases monocyte cytokine responses. Surface desialylation was determined by FITC-conjugated E. cristagalli agglutinin staining of human THP-1 monocytes infected with WT S. pneumoniae or ΔNanA mutant for 3 h. Green line, MOI = 10; pink line, MOI = 3; blue line, MOI = 1. (B) Time course analysis of proinflammatory cytokine production. THP-1 cells were infected with WT S. pneumoniae or ΔNanA mutant at an MOI = 10 for 30 min or 1, 2, or 4 h, and the amount of IL-6, IL-8, and TNF-α produced in the culture supernatant was measured by ELISA. Experiments were conducted three times with biological duplicates. (C) TNF-α concentration in supernatants collected 3 h postinfection from THP-1 cells challenged with WT S. pneumoniae, ΔNanA mutant, or the ΔNanA mutant strain complemented with NanA or enzymatically inactive NanA expression plasmids. Experiments were performed twice with biological duplicates. (D) Addition of recombinant Arthrobacter ureadaciens sialidase (rAUS, 50 mU/ml) from Arthrobacter ureadaciens did not undo the reduction in the level of TNF-α stimulation observed with the ΔNanA mutant. (E) Purified recombinant NanA alone did not induce TNF-α release from unstimulated or lipoteichoic acid (LTA)-stimulated THP-1 monocytes. SPN, S. pneumoniae. (F) Permeabilization of hBMEC monolayers. Culture supernatants of THP-1 cells were collected 4 h after infection with WT S. pneumoniae or the ΔNanA mutant strain or mock infection, and then the permeability of hBMECs was assessed by measuring HRP passage following an 8-h incubation of hBMECs with the collected THP-1 supernatants. Experiments were done twice with biological triplicates. H.I., heat inactivated. (G) Neither WT S. pneumoniae bacterial culture supernatant nor purified recombinant NanA is sufficient to induce hBMEC permeability, indicating that NanA-mediated cytokine induction from THP-1 cells is the major inducing factor. VEGF = vascular endothelial growth factor, used at 200 ng/ml as a positive control. Statistical analysis was performed using Student’s t test (B) or one-way analysis of variance (ANOVA) with Tukey’s posttest (C and F). ***, P < 0.001; **, P < 0.01; *, P < 0.05.

