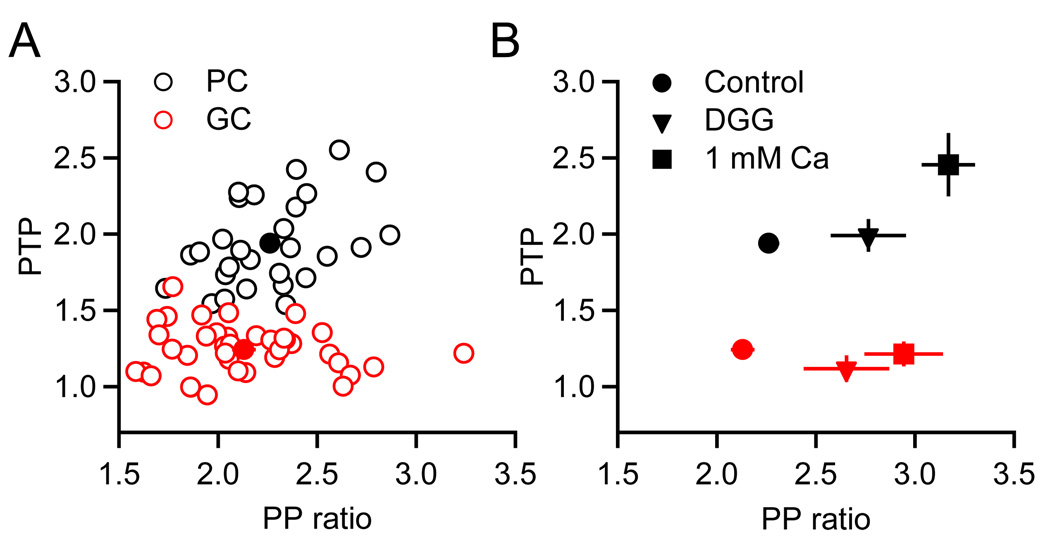
Figure 6. Target-specific differences in PTP do not depend on initial release probability.
(A) Graph plots the magnitude of PTP (EPSC amplitude at Δt = 1 s following burst, normalized to EPSC prior to burst) as a function of paired-pulse ratio for PCs (n = 28, black symbols) and GCs (n = 38, red symbols). Filled symbols denote average values. (B) Average values for PTP and paired-pulse ratio for control conditions (circles, same as (A)), 2 mM DGG (triangles, n = 6 PCs, n = 8 GCs) and 1 mM external calcium (squares, n = 6 PCs, n = 6 GCs), for PCs (black) and GCs (red).

