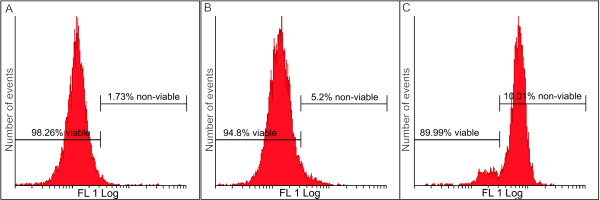
Figure 2.
Mitochondrial membrane potential was investigated by means of flow cytometry using the,5',6,6'-tetrachloro-1,1',3,3'- tetraethylbenzimidazolylcarbocyanine iodide dye (FL1 Log represented the dye detected by the flow cytometry). A reduction in mitochondrial membrane potential was observed in the 2ME2BM-treated cells (B) when compared to the vehicle-treated cells (A). Figure C depicts MCF-7 cells exposed to actinomycin D which was used as the positive control for the reduction of the mitochondrial membrane potential.

