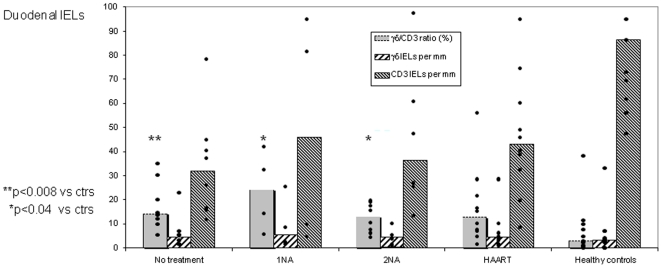
Figure 4. The γδ IEL subset remains elevated in AIDS patients despite antiretroviral treatment.
Scatter diagram shows γδ∶CD3 ratios for duodenal IELs, γδ IEL numbers per mucosal unit (above 1 mm of muscularis mucosae), and numbers of CD3+ IELs per mucosal unit in HIV+ patients – all variables displayed according to administered antiretroviral treatment compared with no treatment and with data from HIV− control subjects. Medians are represented by vertical columns. NA, nucleoside analogue; HAART, highly active antiretroviral therapy.

