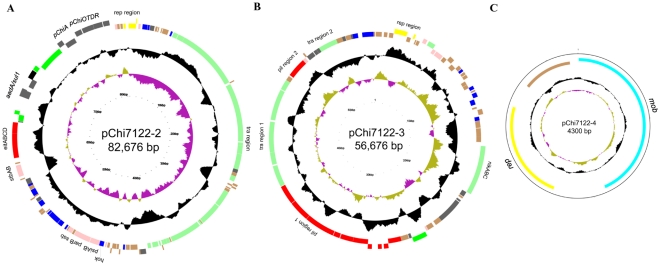
Figure 1. Circular representation of pChi7122-2 (A), pChi7122-3 (B), and pChi7122-4 (C).
The different rings represent (from outer to inner) CDS which are color coded by functional group (ring 1 and 2), deviation from average G+C content (ring 3), and GC skew [(G−C)/(G+C); ring 4]. Colors represent the following: red, virulence-associated; green, plasmid transfer; yellow, plasmid replication; grey other functions; brown, hypothetical protein.

