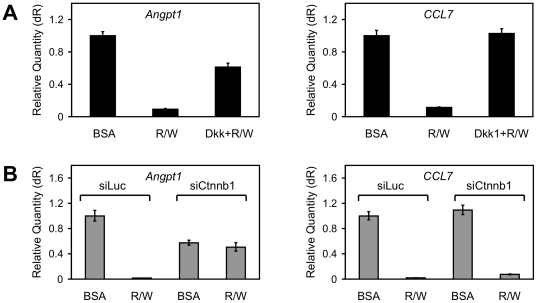
Figure 7. Contrasting effects of Dkk1 and β-catenin knockdown on representative genes down-regulated by Rspo2 and Wnt3a.
(A) Quantitative RT-PCR analysis of Angpt1 and CCL7 expression following 24 h incubation with BSA or Rspo2 (10 ng/ml) plus Wnt3a (100 ng/ml), with or without Dkk1 (1 µg/ml) pre-treatment. (B) Quantitative RT-PCR analysis of Angpt1 and CCL7 expression following 24 h incubation with BSA or Rspo2 (10 ng/ml) plus Wnt3a (100 ng/ml) after pre-treatment with siLuc vs. siCtnnb1. Results in (A) and (B) are means +/− S.D. of triplicate measurements from one of three representative experiments performed simultaneously with experiments illustrated in Figures 4 and 5.

