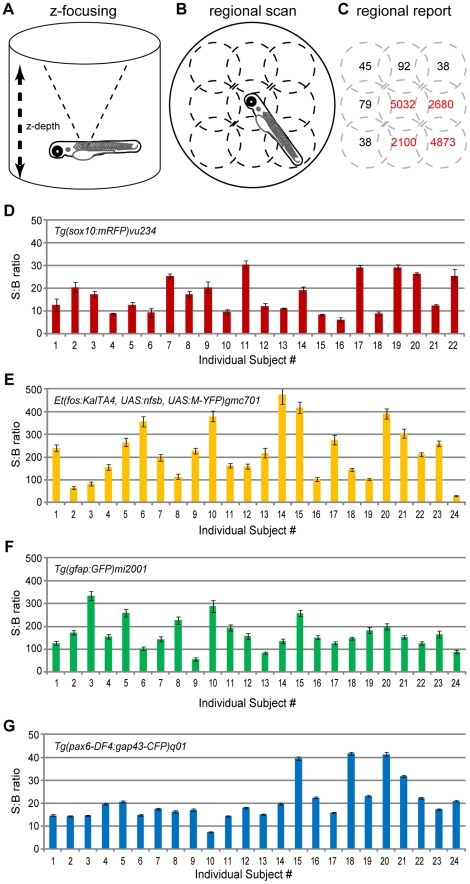
Figure 1. Signal variance across individuals and between fluorphores.
Schematics of the scan functions used to detect fluorescent reporters in transgenic zebrafish. A) Z-focus accounts for alternate well shape depth (e.g. conical) and organisms positioned above the nadir of the well. B) Regional scanning accounts for variations in orientations – shown is a 3×3 scan pattern (dotted line circles). C) Regionalized reporting serves to eliminate Background from Signal calculations (i.e., only regions in red are summed to calculate Total Signal). D–G) The fidelity of ARQiv detection was tested using 2 dpf hemizygous embryos of the indicated transgenic lines. Five full scanning sessions – each consisting of three independent scans averaged – were performed over the course of two hours. The resultant Signal to Background (S:B) ratio averages (± standard deviation) across scans per subject indicate that ARQiv detection of fluorescent reporters is highly reproducible. However, despite consistent detection per each individual, a high degree of variability across individuals and across transgenic lines is evident. At the extreme, this difference could be as much as an order of magnitude between sibling clutchmates (compare #14 to #24 in E). This finding indicates that accurate detection of changes in report expression requires signal levels to be normalized per each individual, optimally to pre-manipulation scan readings (see text for further details).

