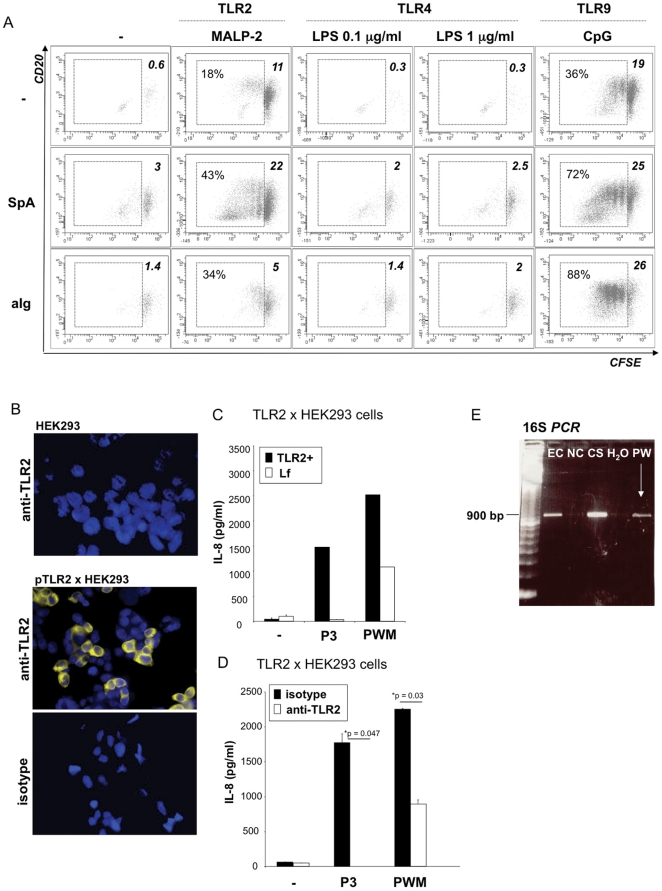
Figure 2. Contribution of TLR ligands to B cell activation.
A: Stimulation of human B cells with TLR ligands. CFSE-labelled CD19+ human B cells were stimulated with or without TLR ligands (TLR2 ligand MALP-2, TLR4 ligand LPS (0.1 and 1 µg/ml) or TLR9 ligand CpG ODN 2006 (CpG)) and/or BCR stimuli (5 µg/ml SpA or anti-Ig (aIg)). After 5 days cells were harvested, stained with anti-CD20 and analyzed by flow cytometry. The graphs depict cell survival (percentage of live gated cells; upper right angle) and cell proliferation (CFSE dilution; % proliferating cells of live gated cells (left) where indicated). The experiment shown is representative of n≥3 experiments. B–D: Assessment of TLR2 activity in PWM preparations. HEK293 cells were transfected with pTLR2 or lipofectamine alone (Lf). B: non-transfected and pTLR2-transfected HEK293 cells were stained for TLR2 expression with anti-TLR2 mAb or the respective isotype control as indicated. C: HEK293 cells transfected with pTLR2 or Lf only were stimulated with Pam3CSK4 (P3) or PWM (10 µg/ml). After 24 hours cellular supernatants were collected and analyzed for IL-8 secretion. One representative experiment of n≥3 experiments is shown. D: HEK293 cells transfected with pTLR2 were pretreated with anti-TLR2 mAb or the isotype control before stimulation with Pam3CSK4 (P3) or PWM (10 µg/ml). IL-8 was quantified in the 24 hour supernatants. E: 16S rDNA PCR. DNA isolation and PCR amplification of bacterial 16S ribosomal DNA from DNA from E. coli (EC), a negative clinical specimen (NC), a positive clinical sample (CS) and the PWM preparation (PW) or the water control (H2O), with an expected PCR fragment size of approximately 900 bp.

