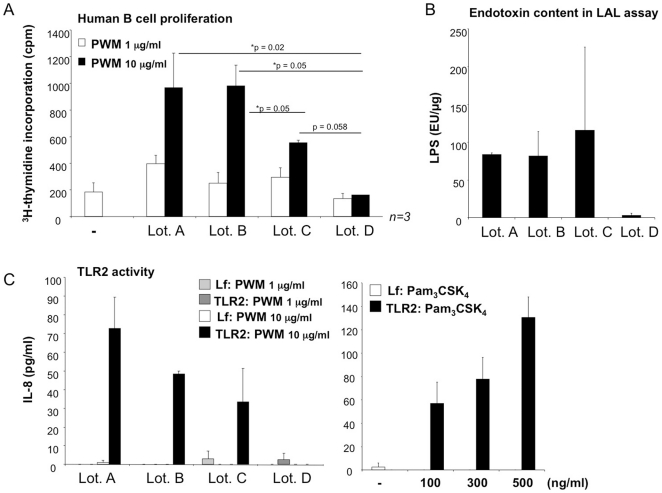
Figure 4. Detection of TLR ligands in PWM preparations.
A: Human B cells were stimulated with different lots of PWM. Proliferation rates were quantified by 3H-thymidine incorporation (cpm = counts per minute). The diagram shows the mean values ± SEM from n = 3 experiments. B: LAL-assay was performed to quantify the LPS content in PWM Lot. A–D. The diagram depicts the mean values ± standard deviation obtained by testing in quadruplicates. C: TLR2 activity was assessed by measuring IL-8 concentrations in the supernatants of pTLR2-transfected or non-transfected HEK293 cells stimulated with different lots of PWM (left) or Pam3CSK4 (right) at the concentrations indicated. One representative experiment performed in triplicates of n = 2 is shown.

