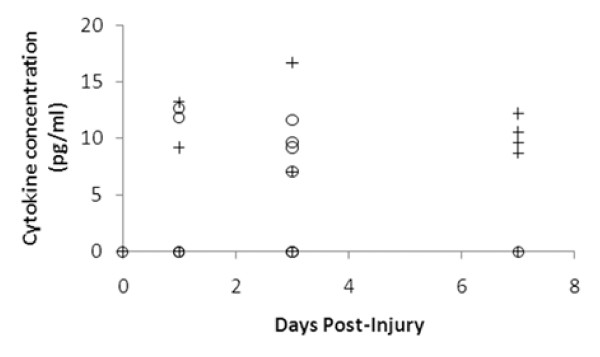
Figure 6.
Scatter plot showing detectable plasma IL-2 concentrations in MT-I/II-/- mice (crosses) and wild type mice (circles) after brain injury. Values below the detection limit (0.4 pg/ml) are not shown. Increases in IL-2 in plasma after injury were sporadic with few animals posting detectable concentrations. At 7 DPI only MT-I/II-/- mice have detectable levels of plasma IL-2. n = 7 for all groups except wild type mice at zero DPI and MT-I/II-/- mice at 7 DPI for which n = 6, error bars = SEM.

