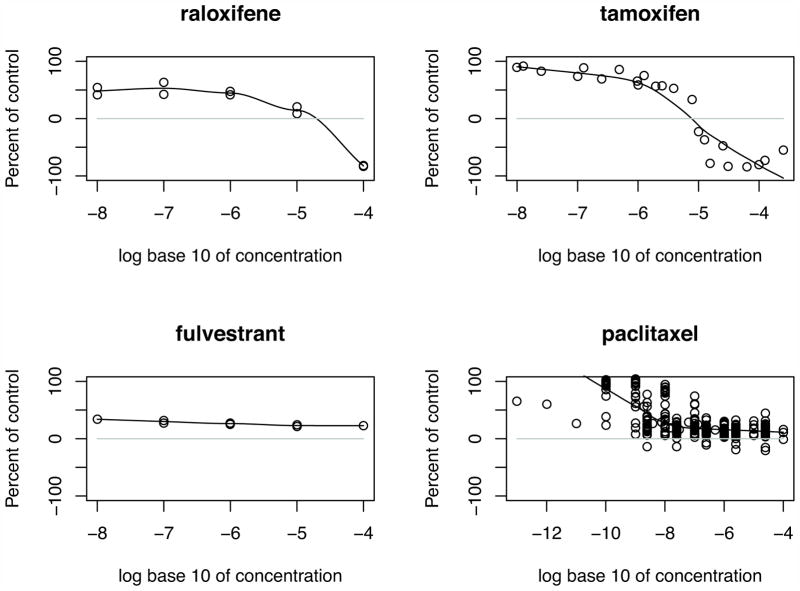
Fig. 5. Dose-response curves for raloxifene, tamoxifen, fluvestrant, and paclitaxel.
The value of dots between 0% and 100% means the drug inhibits the cell growth. The growth percentage of −100 means all cells are killed. The dose-response curves for raloxifene and tamoxifen imply that they induce the cell death at higher dosages while the curve for paclitaxel shows that some experiments also cause the cell death. In contrast, the curve for fulvestrant indicates that at higher dosages fulvestrant does not induce the cell death. The data source is Developmental Therapeutics Program (DTP) of NCI/NIH (31).

