
Figure 6.
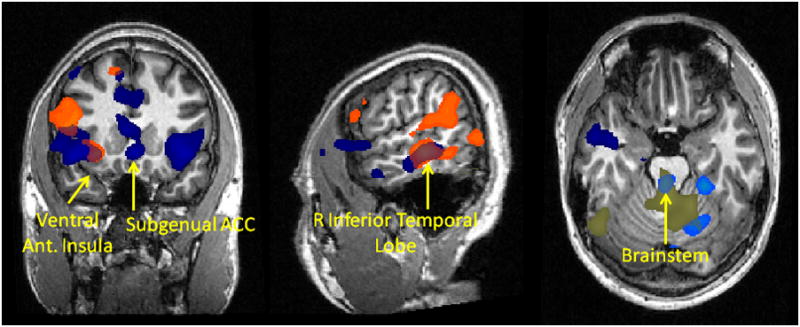
Functional connectivity with right amygdala as a function of drug treatment. Orange = stronger connectivity with right amygdala for OT vs. placebo group, light blue = weaker connectivity with right amygdala for OT vs. placebo group, dark blue = stronger connectivity with right amygdala for AVP vs. placebo group, beige = weaker connectivity with right amygdala for AVP vs. placebo group. T statistic map is thresholded at p<0.05 corrected for multiple comparisons based on the volume of clusters of contiguous voxels.