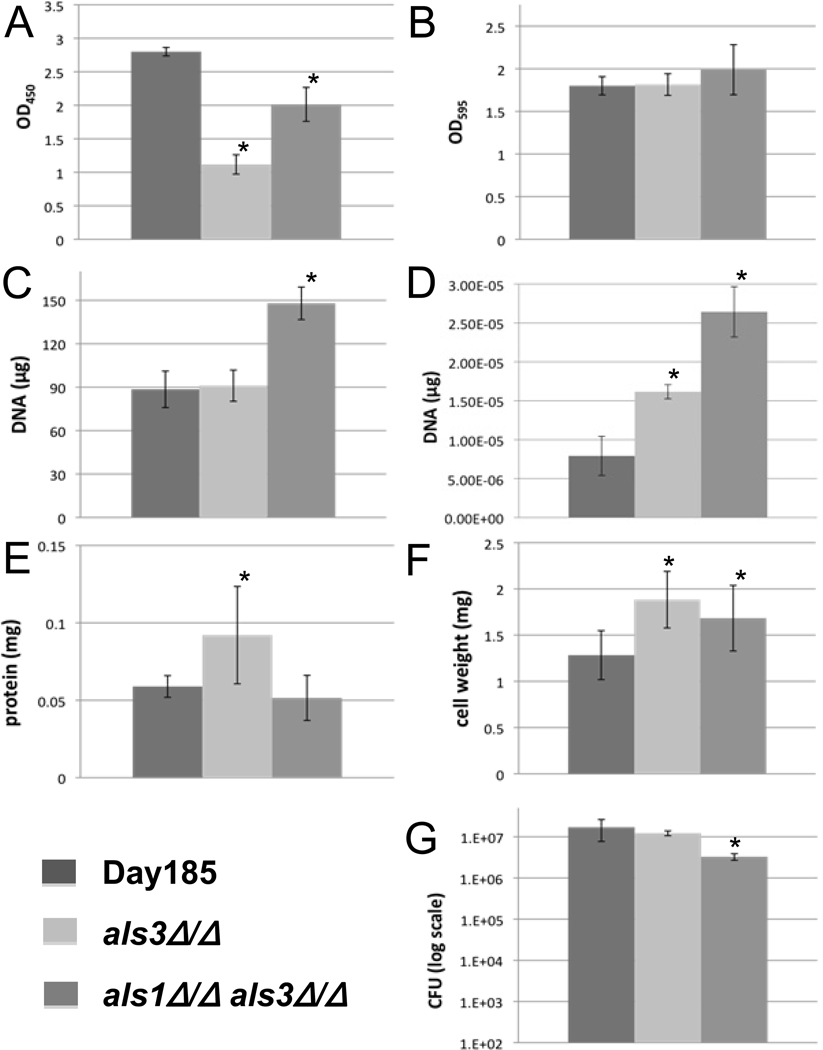
Fig. 2.
Results of seven in vitro biofilm quantification protocols. Each graph represents data of the mean of individual biofilms from a 6-well plate unless otherwise specified. All error bars represent the standard deviations. An asterisk (*) indicates a significant difference between the mutant and parent strain, with a P < 0.05 using ANOVA. (A) and (B) OD490 and OD595 of biofilms using the XTT reduction assay and crystal violet staining, respectively. Six-well bars are the overall average of seven (A) or eight (B) replicates each from six individual wells of biofilm. (C) Biofilm quantification via DNA extraction and quantification. Each bar represents the mean of three extractions. (D) qPCR results measuring the Act1 gene. Bars represent the mean of three DNA extractions, amplified by qPCR each in triplicate. (E) Quantification of the protein in each Candida strain. Bars represent the mean of five wells, each done in triplicate. (F) Dry cell weight of biofilms. The higher values for mutants in E and F were possibly due to the values being near their protocols’ limits of detection. (G) Biofilm quantification by cell plating and viable colony counting. Each bar represents the overall average of four dilutions from each of five wells, each done in triplicate.

