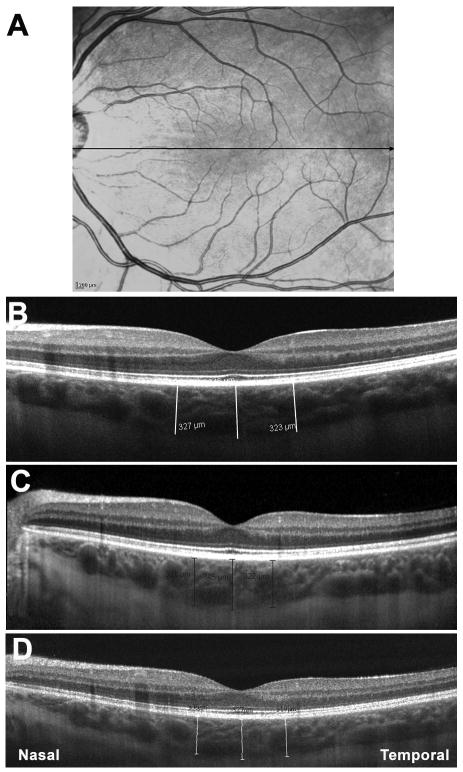
Figure 1.
Optical coherence tomography (OCT) scans showing choroidal thicknesses of the same subject on three different systems. A: Scanning Laser Ophthalmoscopy fundus image used by Spectralis for eye tracking. Black line indicates location and direction of scan pattern. B: OCT image of subject on Cirrus. Image averaging is used for choroidal visualization. White lines indicate choroidal thickness measurements taken perpendicularly from the outer edge of the hyper-reflective retinal pigment epithelium (RPE) to the inner sclera at the fovea, 750 μm temporal to the fovea and 750 μm nasal to the fovea. C: OCT image of subject on Spectralis. Image averaging with the aid of eye tracking and enhanced depth imaging are used for choroidal visualization. Black lines indicate choroidal thickness measurements at the fovea, 750 μm temporal to the fovea and 750 μm nasal to the fovea. D: OCT image of subject on RTVue. Image averaging and enhanced depth imaging are used for choroidal visualization. White lines indicate choroidal thickness measurements at the fovea, 750 μm temporal to the fovea and 750 μm nasal to the fovea.

