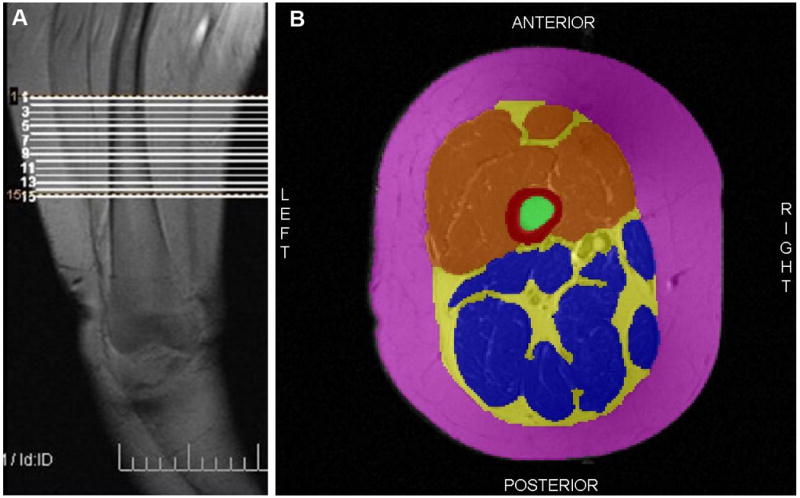
Figure 3.

(A) Coronal MRI scout scan of right thigh showing region of interest. (B) Example of a segmented MRI of the right thigh. Red is cortical bone, green is bone marrow, orange is quadriceps muscles, blue is all other muscles, yellow is intermuscular fat and pink is subcutaneous fat.
